UPDATE: this year (2024) all relevant info is on Notion.
We did update the image collection of this year, for the rest the info is slightly outdated as it is from last year.
Introduction
Welcome to the online syllabus for Visual Communciation Design, a course for Design for Interaction (DfI) Master program students, and anyone else interested. The learning objectives of this course are to analyse, evaluate and create visual communication:
- Learn to analyse existing visual communication designs.
- Apply emperical methods to quantify visual information communication.
- Visually communication with code (with P5.js).
Course material
See Brightspace for reading material and lectures.
- Vision and Depiction by Wijntjes & (a little bit of) Middelkoop. It is a draft version of the book we are working on. Besides a good outline/summery of the lectures it include spelling mistakes, repetitions, unfinished paragraphs and dead hyperlinks: feel free to notify us about unclarities. Here is the intro if your are interested, the rest is on Brightspace.
Course results 2021
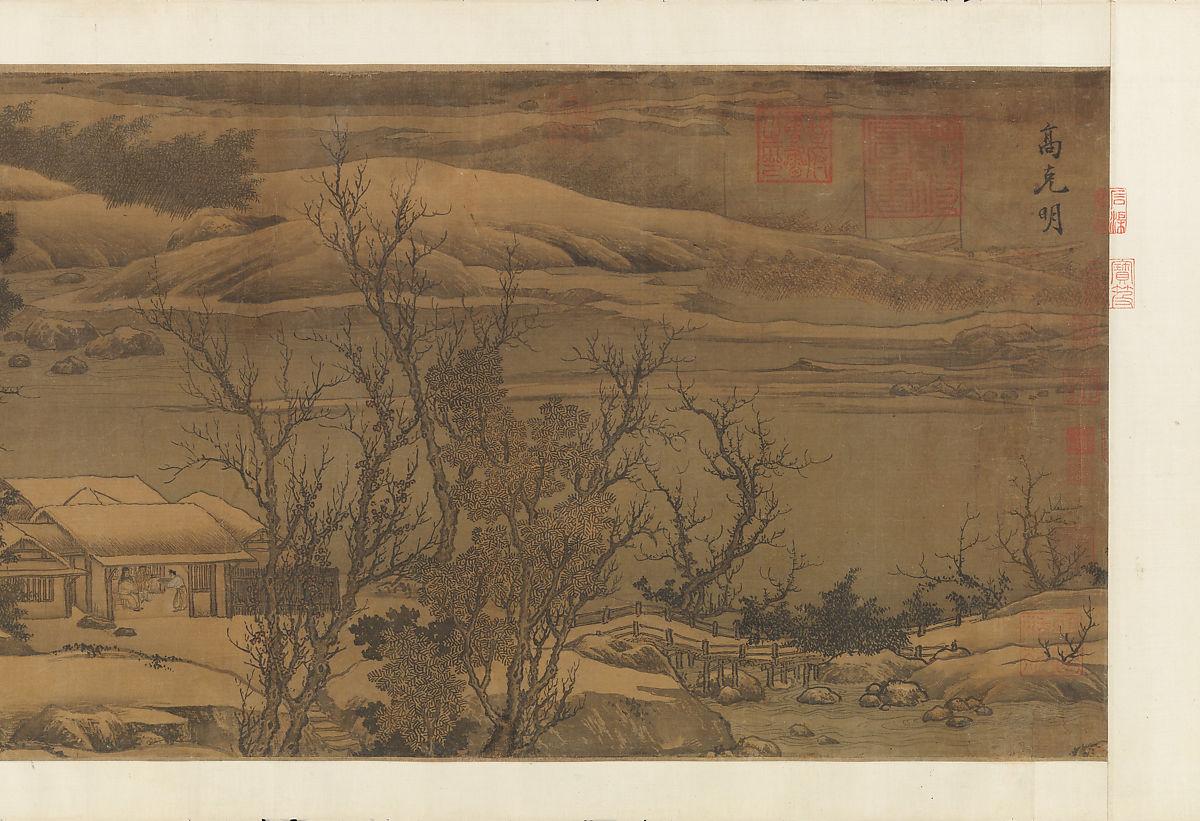
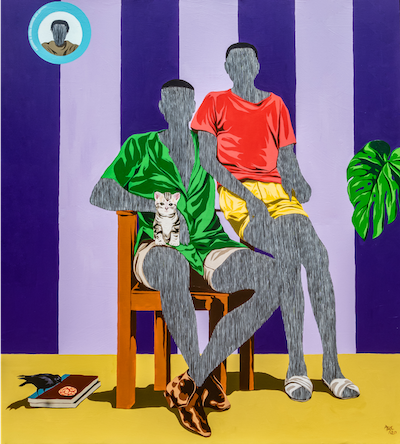
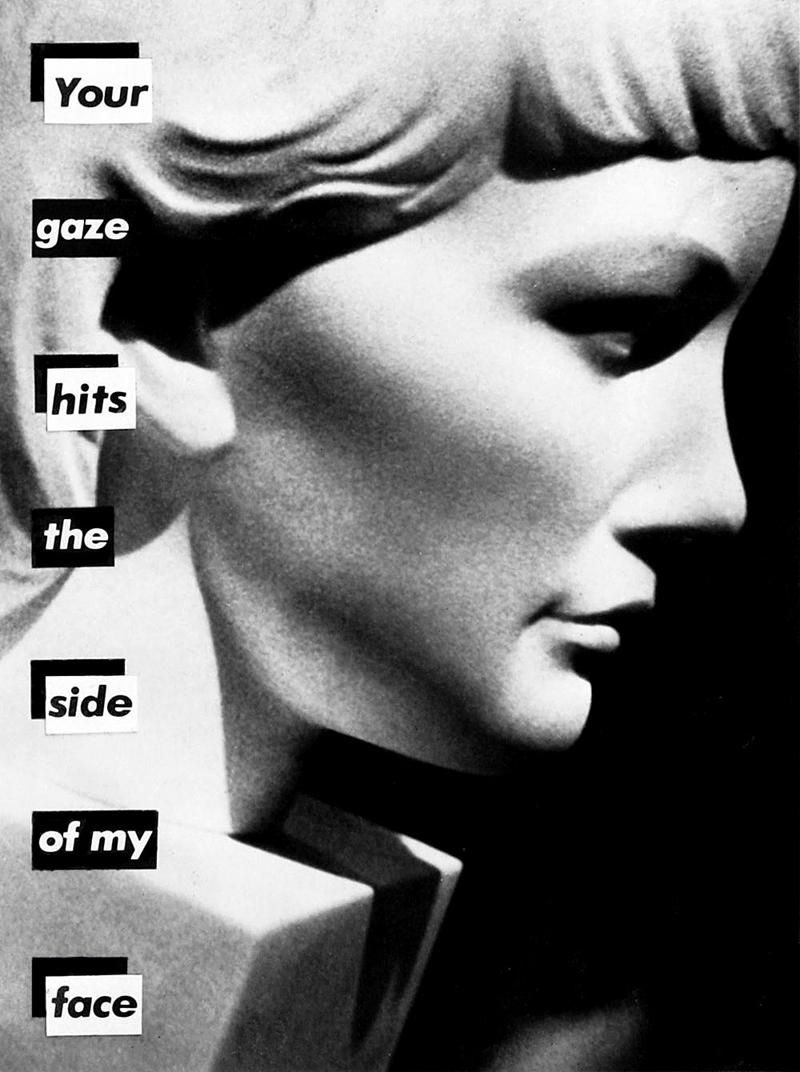
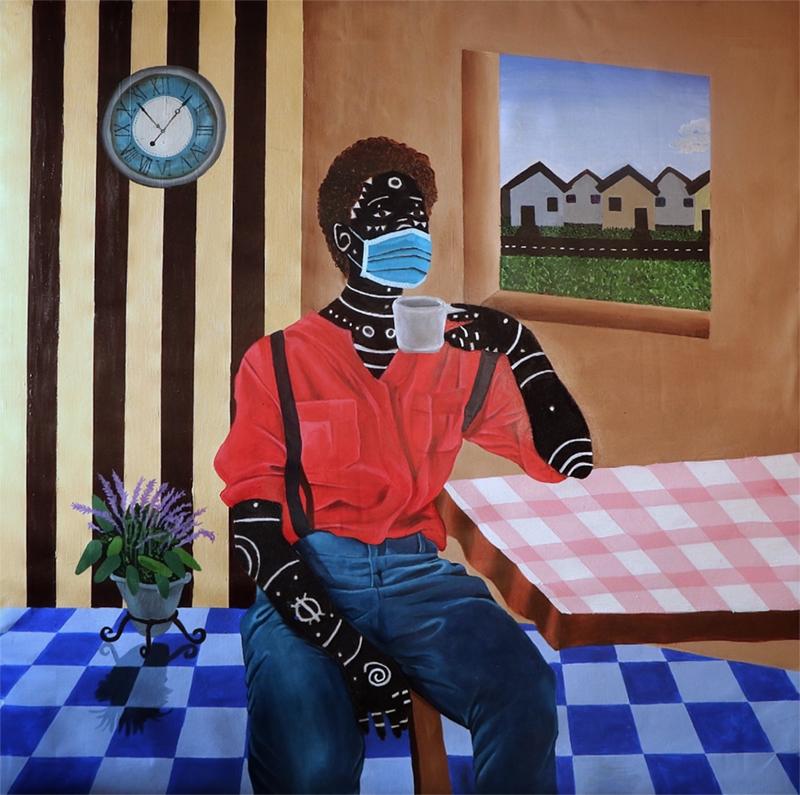
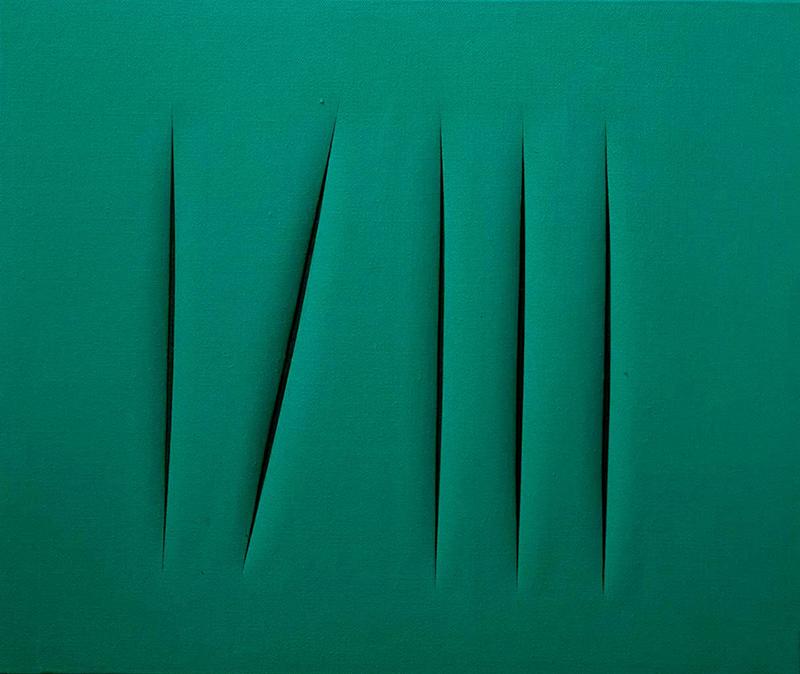
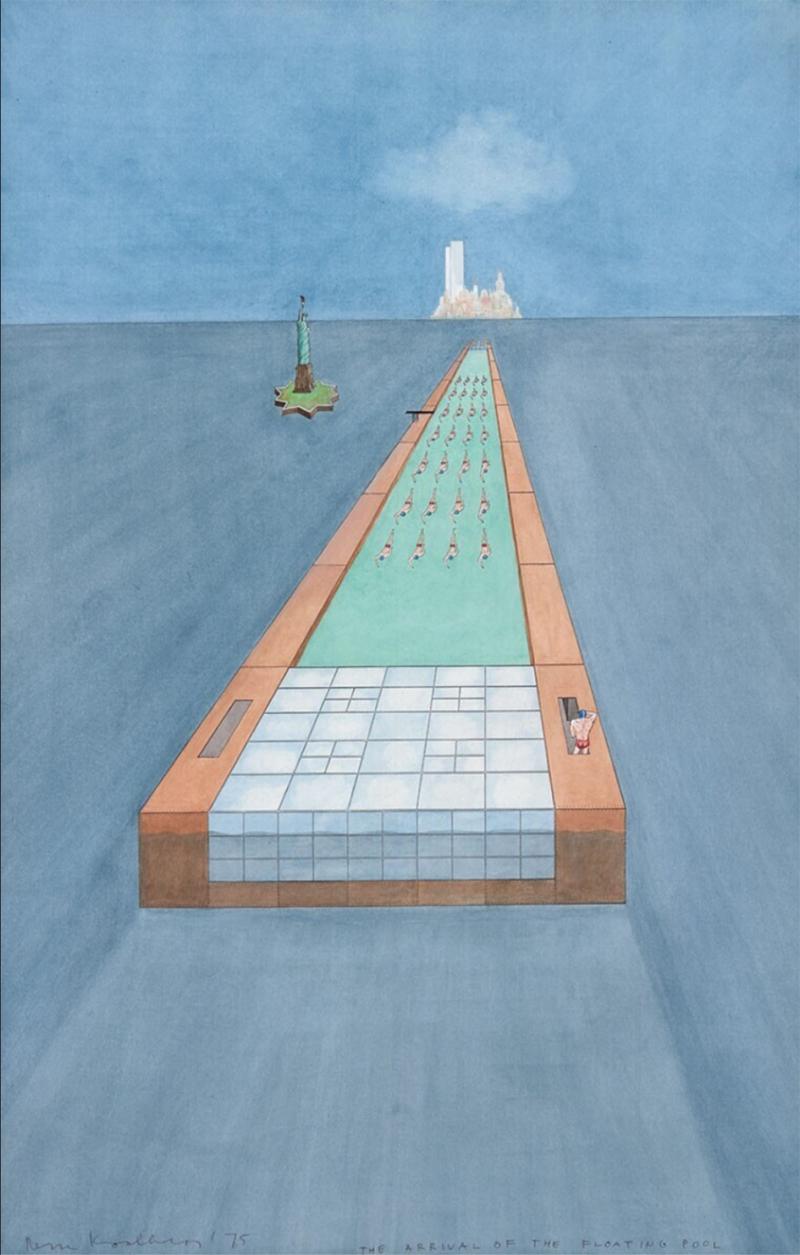
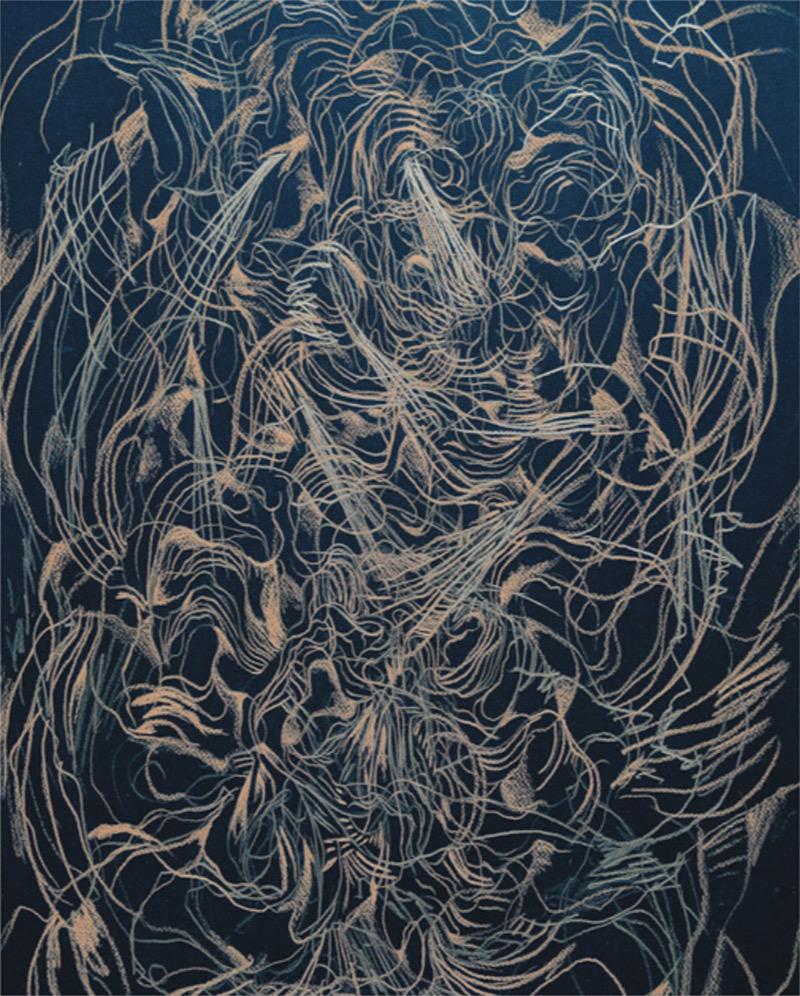
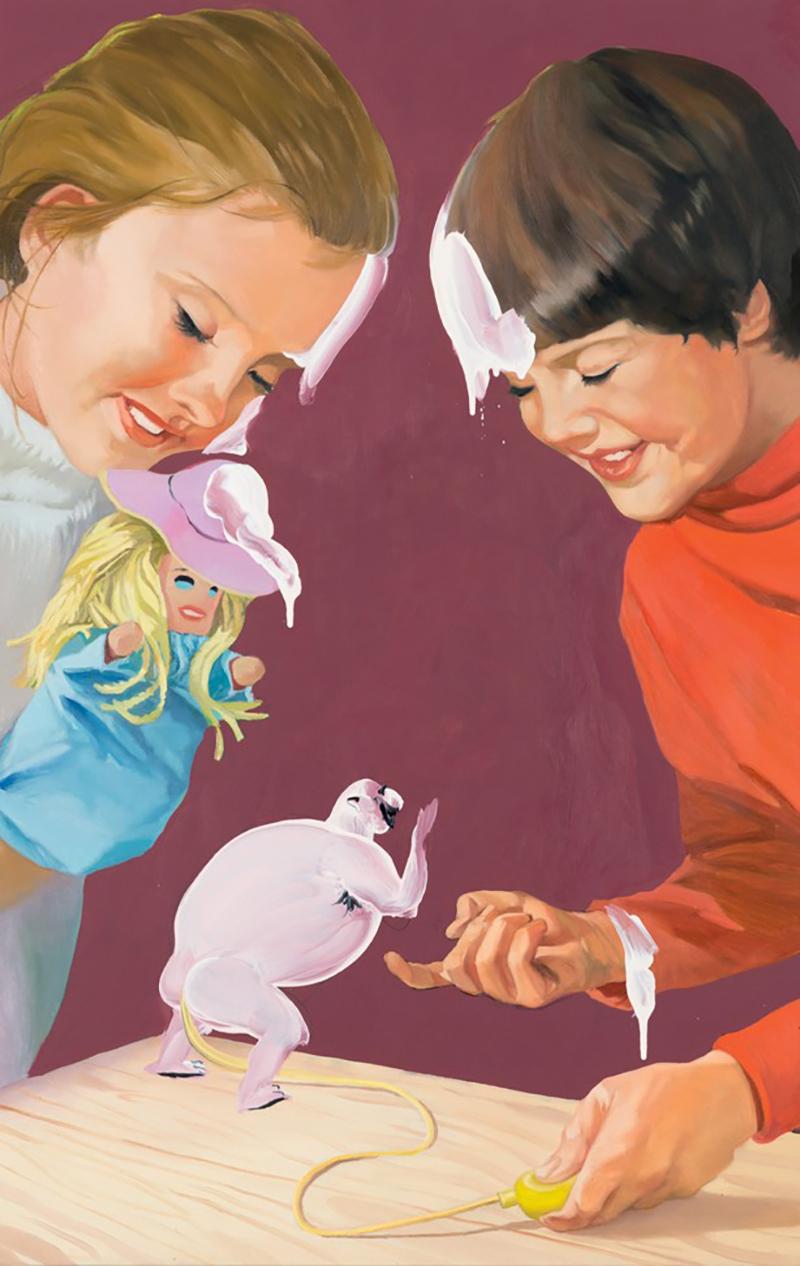
Every year we study existing visual artworks from three perspectives: theoretical analysis, empirical psychological experiments and visual design in p5.js. Below you will see a very small selection of that last part, the p5.js creations. This is not necessarily the top 8 but they are all very good and give a nice first impression.
P.S. If the p5.js links don’t work, try another browser (e.g. Chrome). Oh yes, and be prepared to activate you webcam as many students enthusiastically used face or body tracking.
 source |
 P5 sketch |
|---|---|
 source |
 P5 sketch |
 source |
 P5 sketch |
 source |
 P5 sketch |
 source |
 P5 sketch |
 source |
 P5 sketch |
 source |
 P5 sketch |
 source |
 P5 sketch |
Course results 2020
The original image selection we used on 2020 can be seen here, and part of the outcome can be seen here. On Brightspace you can also find some feedback videos of last year.
Teachers
Maarten Wijntjes
Catelijne van Middelkoop
Yuguang Zhao
Colour gradient
This years’ colour gradient is based on the paper Orange & Teal by Jan Koenderink and Andrea van Doorn. They always publish inspiring and original views, albeit sometimes a little bit technical, but hey, are we at the Delft University of Technology or not!?